今週のお題「2019年の抱負」
かなり出遅れてるけど、前から気になっていたTensorFlowがどんなものか試してみる。なお、私の機械学習、ディープラーニングの知識は『ゼロから作るDeep Learning ―Pythonで学ぶディープラーニングの理論と実装』を一回読んで試した程度なので間違いがあればご指摘いただけると嬉しいです。
TensorFlowとは
Wikipediaによると、
TensorFlow(テンソルフロー)とは、Googleが開発しオープンソースで公開している、機械学習に用いるためのソフトウェアライブラリである。 (中略) 機械学習や数値解析、ニューラルネットワーク(ディープラーニング)に対応しており、GoogleとDeepMindの各種サービスなどでも広く活用されている。 (中略) 対応プログラミング言語はC言語、C++、Python、Java、Go[9]。
今回はチュートリアルを試したいし、素直にPythonを使おう。
インストール
pipでインストールする。
pip install tensorflow
Basic classification
公式TutorialのBasic classificationを試す。
Train your first neural network: basic classification | TensorFlow
Fashion MNISTデータセットのインポート
ニューラルネットワークを使って衣類画像の分類をする。衣類画像にはFashion MNISTというデータセットを使用する。データセットというと手書きの数字画像のMNISTが定番だが、こんなオシャレなデータセットがあるとは。

# TensorFlow and tf.keras
import tensorflow as tf
from tensorflow import keras

# Helper libraries
import numpy as np
import matplotlib.pyplot as plt

fashion_mnist = keras.datasets.fashion_mnist    # Fashon MNISTのデータセット取得
(train_images, train_labels), (test_images, test_labels) = fashion_mnist.load_data()    # 画像とラベルをロード
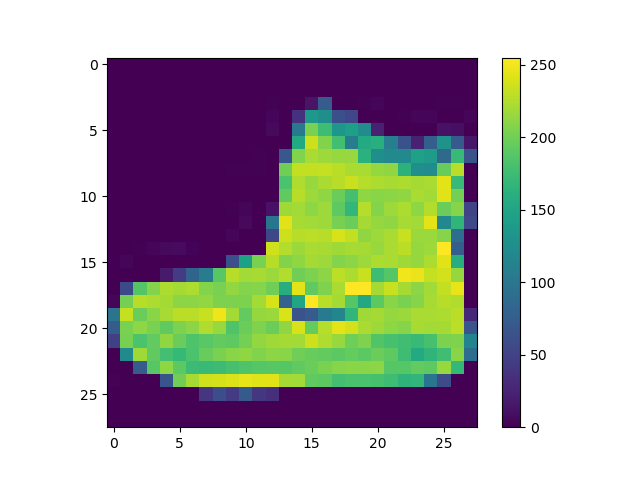
画像は訓練用が60,000枚、テスト用が10,000枚。28x28のNumPyの行列データになっており、ピクセルの値は0−255、ラベルは0−9の値を取る。
| Label | Class |
|---|---|
| 0 | T-shirt/top |
| 1 | Trouser |
| 2 | Pullover |
| 3 | Dress |
| 4 | Coat |
| 5 | Sandal |
| 6 | Shirt |
| 7 | Sneaker |
| 8 | Bag |
| 9 | Ankle boot |
データの確認
データを確認する。
# 画像の形式と数を出力
print("train_images.shape: " + str(train_images.shape))
print("len(train_labels): " + str(len(train_labels)))
print("test_images.shape: " + str(test_images.shape))
print("len(test_labels): " + str(len(test_labels)))

# 訓練用画像の1つを表示
plt.figure()
plt.imshow(train_images[0])
plt.colorbar()
plt.grid(False)
plt.show()
出力:
train_images.shape: (60000, 28, 28)
len(train_labels): 60000
test_images.shape: (10000, 28, 28)
len(test_labels): 10000

データの前処理
後の処理のためにデータを正規化する。
# 各ピクセルの値が0-1の範囲になるよう正規化
train_images = train_images / 255.0
test_images = test_images / 255.0

# 25個の訓練用画像を表示
plt.figure(figsize=(10,10))
for i in range(25):
    plt.subplot(5,5,i+1)
    plt.xticks([])
    plt.yticks([])
    plt.grid(False)
    plt.imshow(train_images[i], cmap=plt.cm.binary)
    plt.xlabel(class_names[train_labels[i]])
plt.show()
出力:

モデル構築
いよいよモデル構築。
ニューラルネットワークの構築にはモデルの設定と、モデルのコンパイルが必要。
# モデル構築
model = keras.Sequential([
    keras.layers.Flatten(input_shape=(28, 28)),         # 1次元の行列に変換(28x28 -> 1x784)
    keras.layers.Dense(128, activation=tf.nn.relu),     # 128個のノードのReLUレイヤー
    keras.layers.Dense(10, activation=tf.nn.softmax)    # 10個のノードのSoftmaxレイヤー
])
ニューラルネットワークはレイヤーという基本ブロックからなる。
1つ目のレイヤーtf.keras.layers.Flattenは28x28の2次元の画像を28 * 28 = 784の1次元の行列に変換する。
次の2つはtf.keras.layers.Dense。1つ目のDenseレイヤーは128個のノードを持ったReLUレイヤー。2つ目のDenseレイヤーは10個のノードを持ったsoftmaxレイヤー。今回は10のクラスに分類するから10個のノードになっている。画像を入力したときに、その画像がそれぞれのクラスである確率(T-shirt/topである確率が○%、Trouserである確率が○%、…)を示すスコアを持つ。
訓練の前に少し設定が必要。
損失関数
訓練中のモデルの精度を測る関数。この関数の値を最小化するよう最適なパラメーターを探索する。
最適化手法
モデルの更新手法。このチュートリアルではAdamを使っている。
メトリクス
訓練を観察するのに使うもの。このチュートリアルでは精度(accuracy)を使っている。
# モデルのコンパイル
model.compile(optimizer=tf.train.AdamOptimizer(),
              loss='sparse_categorical_crossentropy',
              metrics=['accuracy'])
モデルの訓練
ニューラルネットワークの訓練は次の手順で行う。
- モデルに訓練データ(
train_images、train_labels)を与える。 - 画像とラベルを結びつけるよう学習する。
- テストデータで推定できているかを確認する。
訓練はmodel.fitメソッドで行う。エポックは5。また、評価はmodel.evaluateで行う。
# モデルの訓練
model.fit(train_images, train_labels, epochs=5)

# 精度の評価
test_loss, test_acc = model.evaluate(test_images, test_labels)
print('Test accuracy:', test_acc)
出力:
Epoch 1/5
2018-12-16 22:37:28.853877: I tensorflow/core/platform/cpu_feature_guard.cc:141] Your CPU supports instructions that this TensorFlow binary was not compiled to use: AVX2 FMA
60000/60000 [==============================] - 3s 51us/step - loss: 0.5004 - acc: 0.8236
Epoch 2/5
60000/60000 [==============================] - 3s 47us/step - loss: 0.3734 - acc: 0.8653
Epoch 3/5
60000/60000 [==============================] - 3s 44us/step - loss: 0.3350 - acc: 0.8786
Epoch 4/5
60000/60000 [==============================] - 3s 44us/step - loss: 0.3104 - acc: 0.8866
Epoch 5/5
60000/60000 [==============================] - 3s 44us/step - loss: 0.2907 - acc: 0.8935
10000/10000 [==============================] - 0s 26us/step
Test accuracy: 0.8615
訓練データでは89.35%の精度だったのに対し、テストデータでは86.15%の精度だった。公式チュートリアルのページの実行結果でも同じくらい。このギャップは過学習(訓練データのみに過度に対応すること)によるものとのこと。なるほど。
推定
訓練したモデルで画像の推定をする。model.predictで推定を行うことができる。
# 画像の推定
predictions = model.predict(test_images)
print("predictions[0]: " + str(predictions[0]))
出力:
predictions[0]: [2.5721010e-06 5.4826944e-07 1.3219036e-06 1.2262291e-07 6.3263997e-06
 4.7751527e-02 1.5072740e-05 1.3140085e-02 1.1068496e-04 9.3897170e-01]
ラベル9の確率が93.90%で一番高いことがわかる。
複数の推定結果を表示する。
def plot_image(i, predictions_array, true_label, img):
  predictions_array, true_label, img = predictions_array[i], true_label[i], img[i]
  plt.grid(False)
  plt.xticks([])
  plt.yticks([])

  plt.imshow(img, cmap=plt.cm.binary)

  predicted_label = np.argmax(predictions_array)
  if predicted_label == true_label:
    color = 'blue'
  else:
    color = 'red'

  plt.xlabel("{} {:2.0f}% ({})".format(class_names[predicted_label],
                                100*np.max(predictions_array),
                                class_names[true_label]),
                                color=color)

def plot_value_array(i, predictions_array, true_label):
  predictions_array, true_label = predictions_array[i], true_label[i]
  plt.grid(False)
  plt.xticks([])
  plt.yticks([])
  thisplot = plt.bar(range(10), predictions_array, color="#777777")
  plt.ylim([0, 1])
  predicted_label = np.argmax(predictions_array)

  thisplot[predicted_label].set_color('red')
  thisplot[true_label].set_color('blue')
# 推定結果の表示
num_rows = 5
num_cols = 3
num_images = num_rows*num_cols
plt.figure(figsize=(2*2*num_cols, 2*num_rows))
for i in range(num_images):
  plt.subplot(num_rows, 2*num_cols, 2*i+1)
  plot_image(i, predictions, test_labels, test_images)
  plt.subplot(num_rows, 2*num_cols, 2*i+2)
  plot_value_array(i, predictions, test_labels)
plt.show()
出力:

精度は86.15%だったから15枚中13枚くらい正解するはず。この結果は14/15正解なので大体あっている。
最後に、1枚の画像を入力して推定結果を出力する。
# 画像の推定
img = test_images[0]
img = (np.expand_dims(img,0))   # バッチのリストに追加する
predictions_single = model.predict(img)
print(class_names[np.argmax(predictions_single[0])])
出力:
Ankle boot
推定できた。
この公式チュートリアル、かなり面白い。そして素人でも(使うだけなら)こんなに難なくできるとは…!今後も少しずつ試してみよう。
Portions of this page are modifications based on work created and shared by Google and used according to terms described in the Creative Commons 3.0 Attribution License.